Full‑Bore
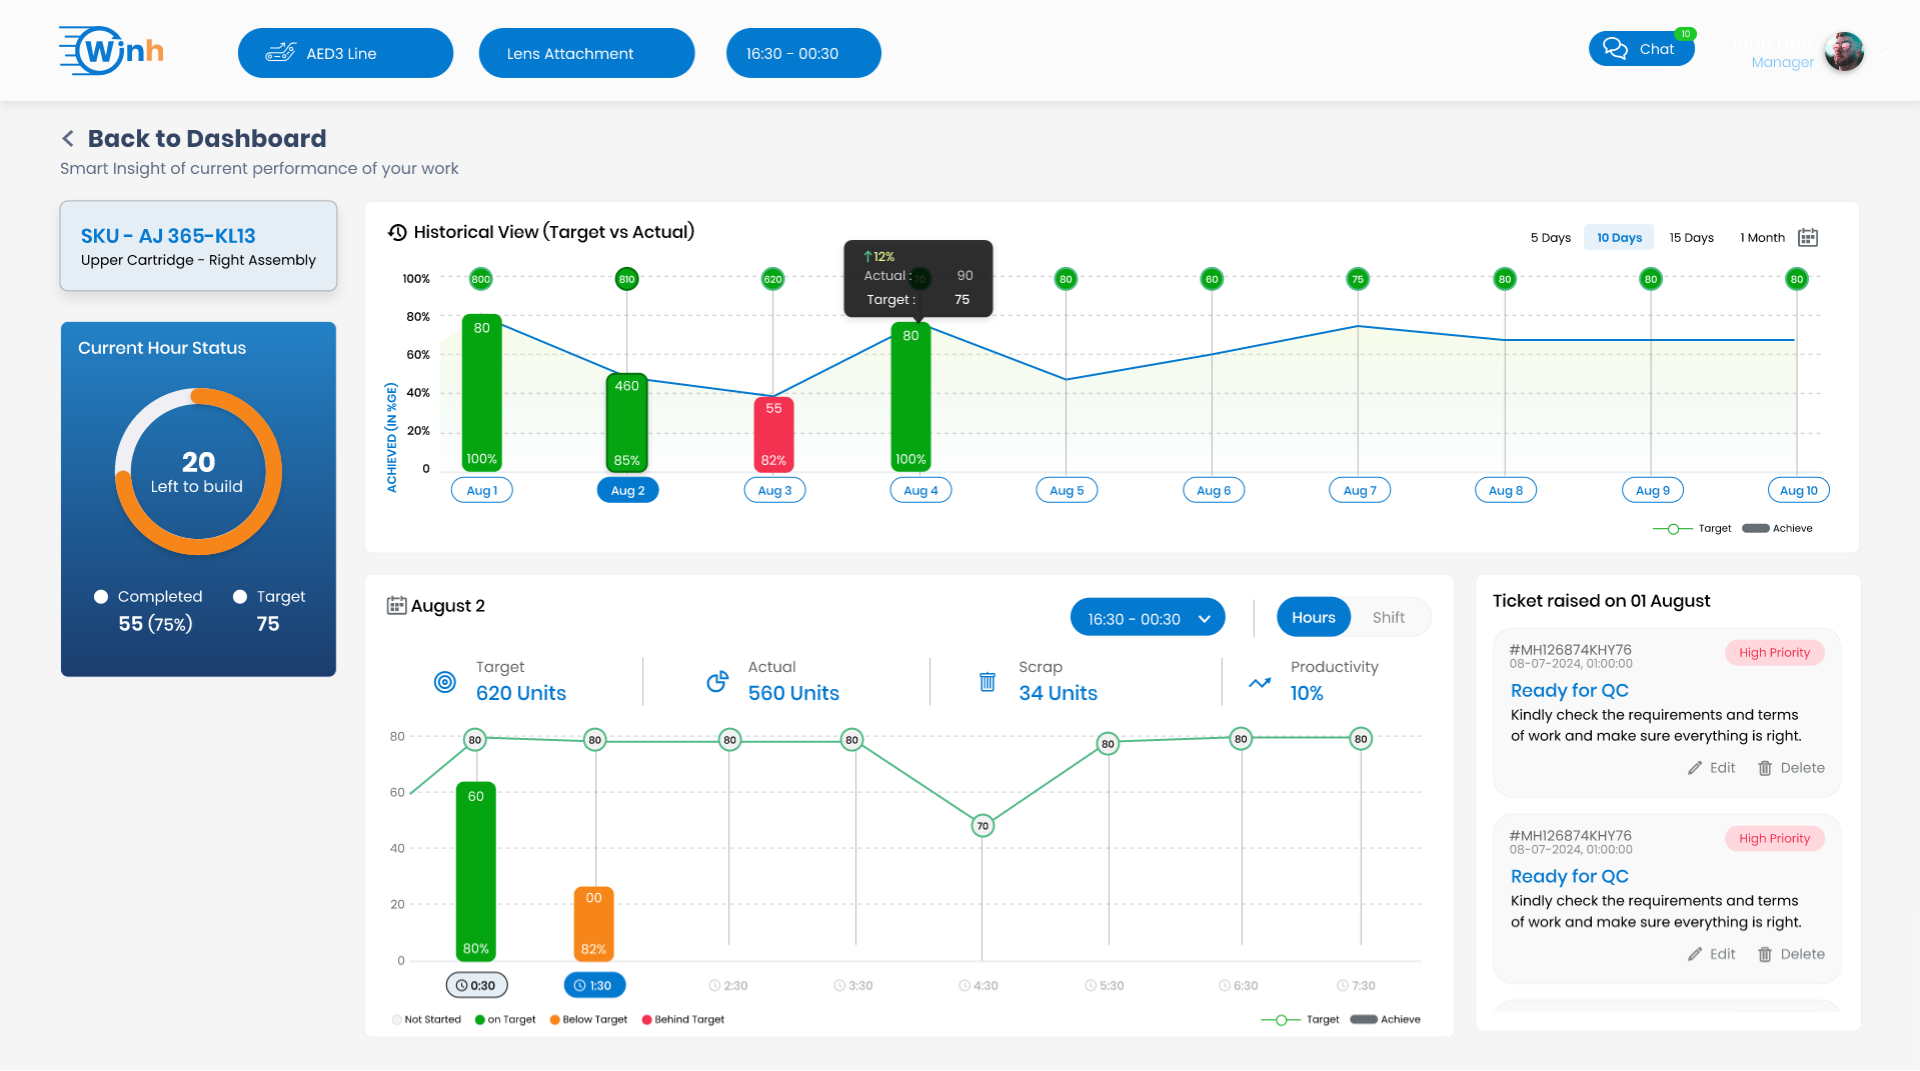
Dashboard design for Full‑Bore’s consulting arm that supports smart manufacturing and digital transformation insight delivery.
View Live SiteProject Overview
Full‑Bore is a manufacturing technology and consulting firm helping SMEs and large enterprises achieve smart‑manufacturing transformation through proven digital interventions and impact‑driven roadmaps :contentReference[oaicite:1]{index=1}. Their consulting platform needed a polished, interactive dashboard to visualize transformation metrics, performance KPIs, and client impact data.
Project Objective
To design a clean, performant, and interactive dashboard UI that communicates real-time project metrics, transformation progress, and impact analytics for Full‑Bore’s clients and internal users.
Project Details
Client
Full‑Bore (Manufacturing Technology & Consulting)
Year
2025
Duration
2 months
Domain
Manufacturing Tech Consulting
Color Theme
primary
#0479D0
secondary
#F6861A
accent
#0479D0
background
#F5F5F5
text
#2D2D2D
Technologies Used
tools
Project Showcase
Key Features
Real‑time KPI metrics and project dashboards
Interactive filters and time‑series charts
Animated transitions with Framer Motion
Material‑UI based design system for consistency
Redux‑powered state synchronization across modules
Responsive layout for desktop and tablet use‑cases
Accessible color contrasts and keyboard navigation
Project Results
The dashboard empowered internal and client users with on-demand visibility into transformation metrics, boosting data-driven decision‑making.
Performance Score
Dashboard loads in under 800 ms even with heavy data sets, tested with Lighthouse metrics.
UX Flow
Users navigate metrics, filters, and project timelines within fewer than 3 clicks, improving intuitive flow.
Animation Fluidity
Used Framer Motion to deliver smooth transitions across key charts and panels.
State Management
Centralized data handling enables consistent real-time updates and filter syncing across components.
Our Process
Discovery & Research
We dive deep into your brand, audience, and goals to build a strategic foundation for the project.
Prototyping & UX
Mapping out user journeys and creating interactive wireframes to define the structure and flow.
Visual Design (UI)
Crafting a stunning, brand-aligned visual identity that ensures a delightful user experience.
Development
Bringing the designs to life with clean, efficient, and scalable code using modern technologies.
Testing & QA
Rigorously testing across devices and browsers to ensure a flawless, bug-free launch.
Launch & Deploy
Deploying the project to the world and ensuring a smooth transition to a live environment.
Iterate & Grow
Analyzing performance data and user feedback to continuously improve and evolve the product.
"The dashboard translates our manufacturing impact data into actionable insight—clear, fast, and visually compelling."
Sudhi Bangalore
Founder & CEO at Full‑Bore
Related Projects
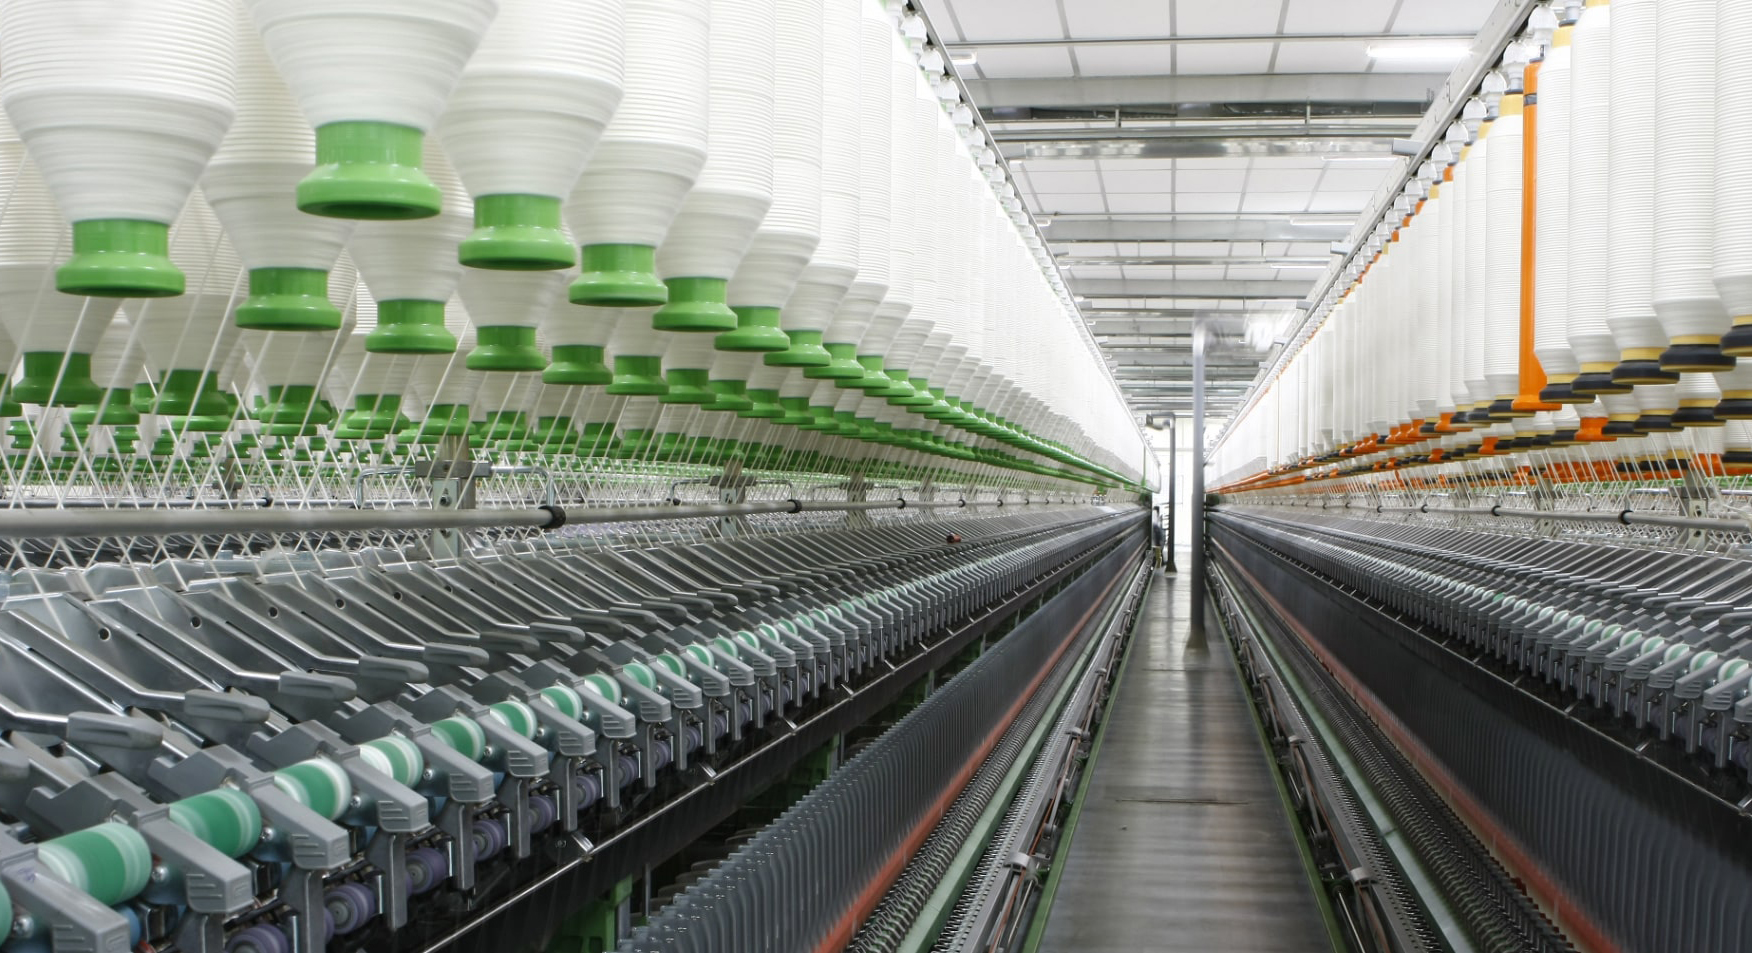
Vardhman
In an industry that thrives on changing trends, agility and flexibility are vital contributors to success. Only those who can outpace stand a chance to out-grow.
Dodhia Group
A future-forward redesign for a global textile and chemical powerhouse driving innovation and sustainability.
Innersmith
A lightweight, elegant, and performance‑focused redesign for the Innersmith brand, emphasizing smooth interactions and visual storytelling.